RNA Secondary Structure Prediction with Mfold
BIOL
265/ COMP 113 Computer Laboratory
M. Weir / M. Rice / D. Krizanc
(modified from a module developed by K. Thayer)
Algorithms are used to predict 2D and 3D structures from 1D molecules. In
today's lab, we will use Zuker's Mfold algorithm to predict structures of a
tRNA. Then the predicted structures will be compared to the known crystal
structure. Later,
we will discuss the Nussinov algorithm for predicting RNA structures. It
can be challenging for algorithms to correctly predict structures; however, it can be
very useful to compare their
outputs with results from other approaches.
RNA molecules play several important roles in the cell, including
- carrying the genetic information transcribed from DNA (mRNA)
- adaptors between mRNA and protein (tRNA)
- structural roles in the composition of the ribosome (rRNA) and spliceosome (small nuclear RNA; snRNA)
Programs
- Mfold program http://www.unafold.org/mfold/applications/rna-folding-form-v2.php
- iCn3D structure
visualization
https://www.ncbi.nlm.nih.gov/Structure/icn3d/full.html
- RasMol
structure visualization http://www.umass.edu/microbio/rasmol/
Database
- Nucleic
Acid Database Project (NDB) http://ndbserver.rutgers.edu/
Objectives
- Predict the secondary structure of tRNAPhe molecule
- View the secondary structure prediction
- Compare the standard free energies of several alternate sub-optimal foldings
- Compare your prediction to the crystal structure using iCn3d or RasMol to view the structure
Step 1. Manual
Prediction of Secondary Structure
Try predicting the secondary structures of the following portion of tRNAPhe: UCCUGUGUUCGAUCCACAGAA. Predicting by hand the stem-loop structure of this short sequence is fairly easy. However, predicting longer sequences is harder.
Step 2.
Using Mfold to Predict Secondary Structure
To fold a longer RNA sequence, go to http://www.unafold.org/mfold/applications/rna-folding-form-v2.php and follow these instructions:
- Enter a name for your sequence (using a helpful, systematic naming convention)
- Copy the RNA sequence into the sequence entry box. For example, the sequence of tRNAPhe is
GCGGAUUUAGCUCAGUUGGGAGAGCGCCAGACUGAANAUCUGGAGGUCCUGUGUUCGAUCCACAGAAUUCGCACCA
- Select no constraints.
- Specify that the RNA sequence is linear, not circular.
- Change percentage suboptimality to 10%.
- Use default values for the rest of the form, i.e. for percent suboptimality, upper bound, window, maximum distance between paired bases, etc.
For small RNA sequences, you can perform an immediate calculation that displays the outputs in your browser's window. Also, you can modify the output display features as you like, e.g. image resolution, structure format, base numbering frequency, and structure annotation.
At the bottom of the form, click the Fold RNA button.
Step 3. Evaluating
the Folding Results
Scroll down to the output options for structure 2. For example, the .ct file contains a listing of the base pairs (columns 1 and 5).
The free energy values (dG) determine how energetically favorable each of the predicted structures are. The more negative the number, the more favorable. Positive numbers are not favored, whereas negative ones are.
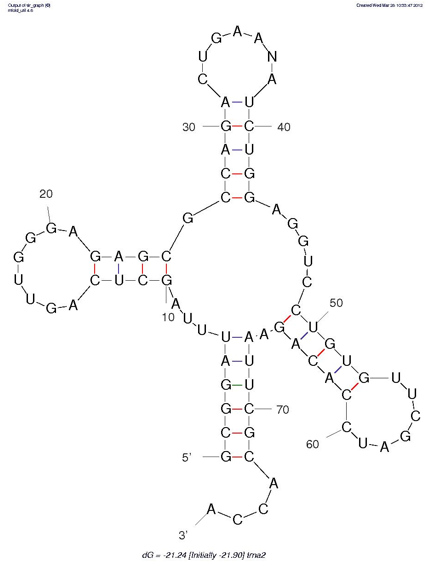
To look at a predicted structure, click on jpg. You can adjust the output from there, with the same options that are available on the query page. [The results will appear in a new window that may be on top; otherwise, look for it on the menu bar at the bottom of your screen.]
How do the structures predicted by Mfold compare to your manual predictions (from Step 1)?
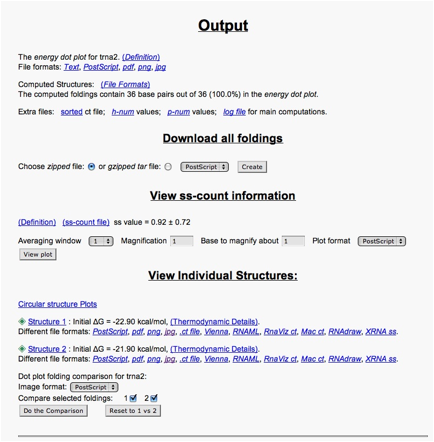
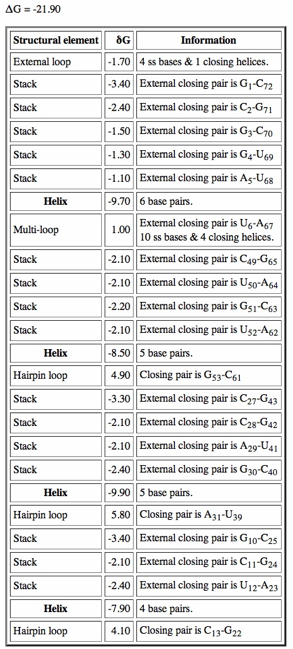
Click on "Loop Free Energy Decomposition". The Helix values are the sum of their stacking interactions. What is the single most stabilizing interaction? Which interactions are destabilizing?
You can also compare the dot plots for the structures. At the bottom of the output page, go to the Dot plot folding comparison for tRNA and select the following options:
- Dot plot folding comparisons for tRNA:
- Image format: "jpg"
- Compare selected foldings: check each of 1 and 2
- Then click Do the Comparison button.
This shows the dot plot for the RNAs. The color coding shows which structure the dot pertains to, including overlap possibilities. (The magnification options should not be needed here because the RNA is small enough that all dots are clearly visible.)
When we run MFOLD, we can adjust the percent suboptimality parameter (default 5%) to find other structures that are less optimal compared to the most stable current structure. Could some of these alternate structures be the functional one (or ones)? Note that the secondary structure prediction with the smallest free energy is not necessarily the functional conformation of the RNA.
Also, in our example, some of the tRNA nucleotides are actually covalently modified (see Alberts et al. and Lodish et al.).
Step 4. Comparison
of 2D prediction to a Crystal Structure
We will now look at known 3D structures and compare these with the predicted
secondary structures.
Using
iCn3D
Go to NCBI and search under structures for yeast phenylanaline tRNA using the PDB term "4TRA". Open 4TRA using iCn3D .
Explore the different rendering representations in the "Style" dropdown menu. "Nucleotides" > "Lines" provides a useful rendering. You can rotate the image by clicking on the image and dragging the mouse. You can highlight nucleotides of interest in the image by highlighting them in the sequence alignment viewer (Analysis > Sequences and Annotations --Details).
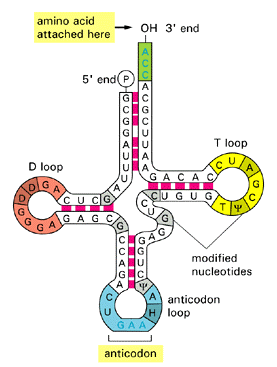
Try highlighting nucleotides that base pair (use the apple/command
key). Compare the base pairing
with the summary diagram below, and with your predicted structures.
Alternative
approach using RasMol
We will now look for the 3D structure in the Nucleic Acid Database at
Rutgers. From the NDB homepage at http://ndbserver.rutgers.edu/, search
for the NDB ID TRNA06 -- this is the ID for PHE tRNA in yeast. In the
"Coordinates + Structure Data" section, click on "Biological
Unit coordinates (PDB format)". This retrieves the information about the
crystal structure in a PDB format. Paste the text into a Notepad file and save
it with the name 1TRA.pdb.
[You
can alternatively obtain the pdb file using Protein Explorer or from NCBI
For example, you can search under "Structure" at NCBI using the pdb code
"1TRA" (the pdb file code for yeast PHE tRNA) Run the Protein
Explorer application at proteinexplorer.org.
The pdb file can be run using RasMol.]
The following instructions show how to use this file to view the molecule in
RasMol. (The RasMol is available on campus, or you can download your own copy
from http://www.umass.edu/microbio/rasmol/.)
[Also, with appropriate MS Explorer configuration, you can use the Protein
Explorer web interface to view structures instead of RasMol. Protein
Explorer may not be as widely available on campus, but it can be run from the Protein
Explorer web server.]
Using
RasMol
Run the RasMol application and open your file by dragging its icon over the black display box. There is one difference in the best structure of your tRNA and the crystal structure - do you notice any base pair that Mfold missed? Check what was observed in the crystal structure. In RasMol, you have to open the command line by clicking on the menu bar at the bottom of your screen the icon called RasMol command line. Then you can type some commands in conjunction with using the pull-down menu to adjust your view.
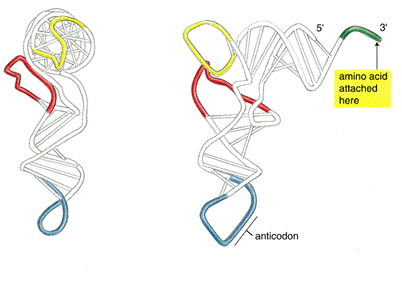
To obtain a labeled view of the structure in RasMol, select the Display option "Wireframe", the Colours option "Group", and the Options "Labels". You can see how the clover leaf structure folds on itself -- two of the stem loops fold back towards the main structure.
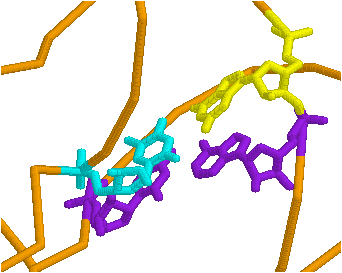
In addition, here are some useful commands in Rasmol that you can use in comparing the known tertiary (3D) structure of the tRNA and the predicted secondary (2D) structures. Equivalent operations are also possible in Protein Explorer.
The counting starts from the 5'end. In the command line, type "select residue 5" (or "select 5"). Now color it yellow by typing "color yellow". You can change how only that residue is displayed by going to the pull-down menu and clicking Display and make your selection. Commands in RasMol apply to whatever is selected.
Use the restrict command in the command line. If you want to see just residues 1 to 8 and 66 to 76, separate the arguments (things the command should execute on), type restrict 1-8,66-76. The rest of the molecule is not visible. To get it back, from the pull down menu, edit>select all, then pick a way to display it. To add something to the restricted part, select it as above and display it using the pull-down menu.
The preceding figure demonstrates what you can do with a combination of these commands.
By selectively coloring the end points of predicted stems, compare the predicted base pairing with the actual base pairing. How do the actual and predicted structures differ?
[From Alberts et al. Molecular Biology of the Cell]
After looking at the crystal structure, can you speculate why the structure predicted by Mfold differs from the crystal structure ?
Step 5. Use
Another RNA Sequence
You can use the list of RNA databases at the beginning of this lab to search for other RNA molecule sequences. Find a molecule of interest to you and answer the following questions:
- What is the name of the molecule and where did you find its sequence?
- What is the standard free energy of this molecule?
- How many alternate structures can Mfold find within 3 kcal of this structure?
- Which structure do you think is the functional one? Save a picture of this molecule.
- Using the dot plot, would you say that the molecules found within 3kcal are similar to each other in secondary structural elements or not?
For example, you could examine yeast 5S ribosomal RNA
5'
GGUUGCGGCCAUAUCUACCAGAAAGCACCGUUUCCCGUCCGAUCAACUGUGUUAAGCUGGUAGAGCCUGACCGAGUAGUGUAUGGGUGACCAUACGCGAAACUCAGGUGCUGCAAUCU
3'
Compare your predicted structure with the following accepted 2D structure from structural studies (http://www.rna.ccbb.utexas.edu/).
Step 6. Review of
Lab Objectives
- Predict the secondary structure of tRNAPhe molecule
- View the secondary structure prediction
- Compare the standard free energies of several alternate sub-optimal foldings
- Obtain the standard free energy contributions
- Generate dot plots of several alternate RNA foldings
- Compare your prediction to the crystal structure using RasMol
- Make your own RNA structure prediction
Assignment
- Print the picture with the best prediction for tRNAPhe and label the picture with energy values listed for helices and loops (see step 3).
- Draw your optimal predicted secondary structure for tRNAPhe above using the (i) circle and (ii) parens representations (you may use the following template: word or pdf).
- Do the modeling algorithms always predict structures correctly? If not, what is the value of these algorithms? Can you imagine ways to improve the algorithms -- what additional information might you incorporate?
Copyright
Wesleyan University 2021